
If you’re looking to build a winning strategy for 2025, then you’ve come to the right place! ROLLER recently released its inaugural Attractions Industry Benchmark Report, which is backed by hundreds of thousands of data points – covering everything from online bookings and guest spending behavior to revenue growth opportunities and technology trends.
In this article, we’ll uncover some of the key takeaways from the report to help you make informed strategic decisions in the year ahead.
Watch the insights
If you’re more of a visual learner, we have you covered! We recently held a webinar focusing on the key takeaways from the 2025 Attractions Industry Benchmark Report. Hosted by ROLLER’s Field GM, Brett Sheridan, and industry expert Greg Schmatz, the session covers the key insights as well as actionable advice from these experienced operators. You can watch it below.
What is the 2025 Attractions Industry Benchmark Report?
ROLLER’s 2025 Attractions Industry Benchmark Report was created to help the ROLLER community and the wider industry navigate the challenges and trends that are set to make 2025 a pivotal year. This includes shifts in guests' behavior and economic challenges. By reflecting on proven data, our aim is to help operators equip themselves with strategies and tools for long-term success.
The report is backed by hundreds of thousands of data points from anonymized venues within ROLLER’s customer network, spanning two key periods: July 1, 2022, to June 30, 2023, and July 1, 2023, to June 30, 2024. We hope each statistic we’ve highlighted will help you assess how your venue stacks up against the broader market, uncover what your guests truly value, and identify actionable ways to increase revenue.
We’ve also included insights and ideas shaped by our years of experience in the attractions industry, with input from team members who’ve worked in the field themselves—offering practical advice that truly makes a difference.
In short, consider the report your roadmap to making 2025 your most successful year yet! And it doesn’t stop here – we look forward to building on this report and delivering a new version each year to help your continual growth.
6 key takeaways from the 2025 Attractions Industry Benchmark Report
The report is absolutely packed with insights and data points that will help you devise a robust strategy. It even goes into granular detail on performance across regions and specific industry segments, such as play centers, trampoline parks, water parks, and many more.
That being said, it’s a detailed document! So, we’re summarizing some of the broader takeaways to help ease you into it. When you’re ready for a detailed look, be sure to download the full report!
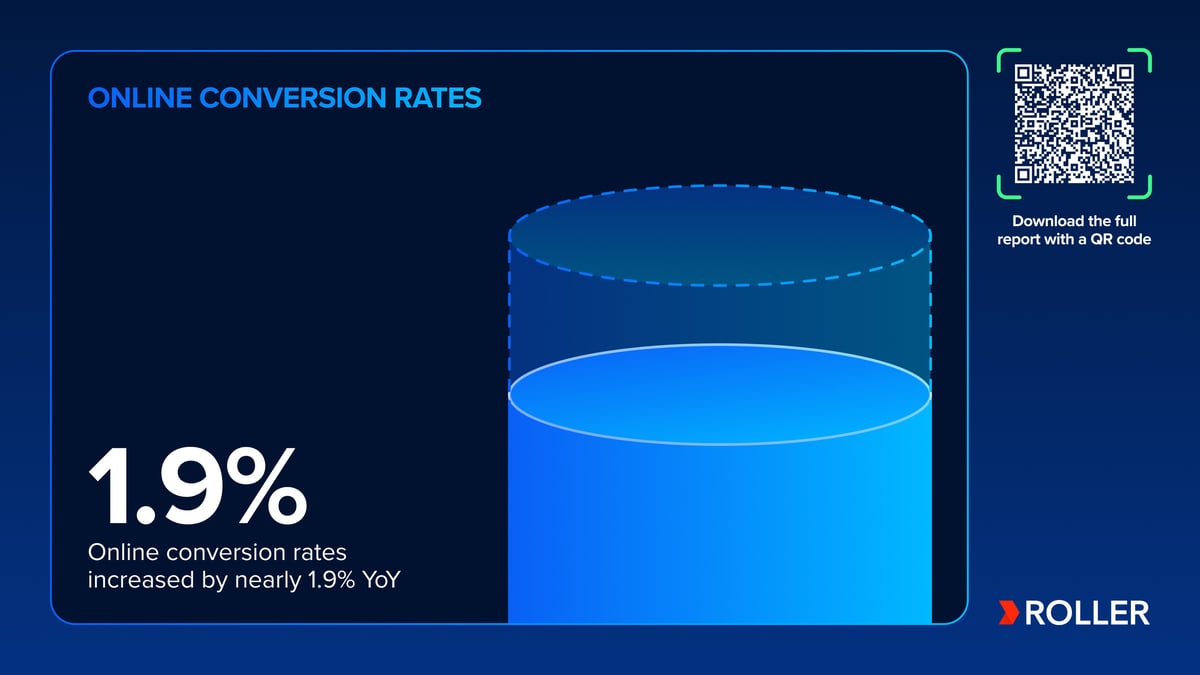
1) Online conversion rates are increasing
Online conversions have increased by 1.9% year-on-year! Growing conversion rates show that guests are finding what they need and booking online with ease. This trend makes it clear that venues within the ROLLER community are nailing the art of turning interest into action, a crucial component for any business focused on growth.
2) Online order values beat in-person purchases
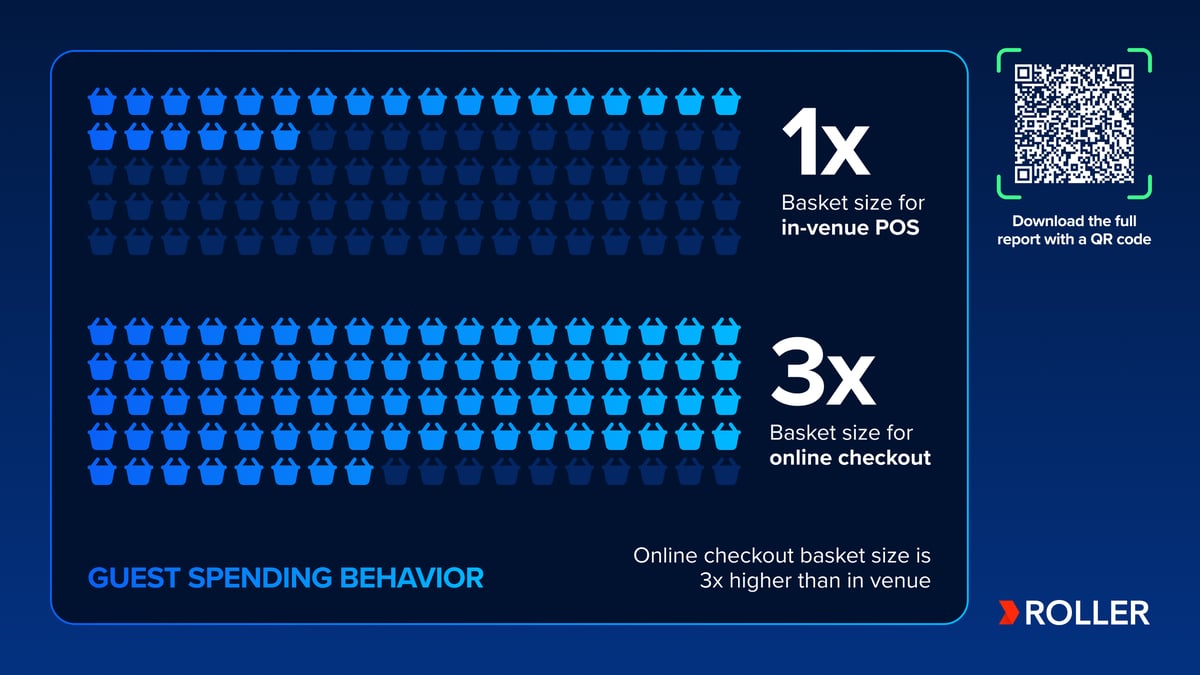
If you're wondering whether people spend more when they book online or when they visit your venue in person, this stat is for you! Not only do people spend more online, but their order values are 3x higher than in-person bookings. This can be attributed to the exceptional value that online party bookings provide, but even when we exclude party bookings, online bookings are still 2.6x larger! Ultimately, the data shows us the power of upsell and cross-sell opportunities during the online checkout process.
3) A vast majority of online bookings are made on mobile devices
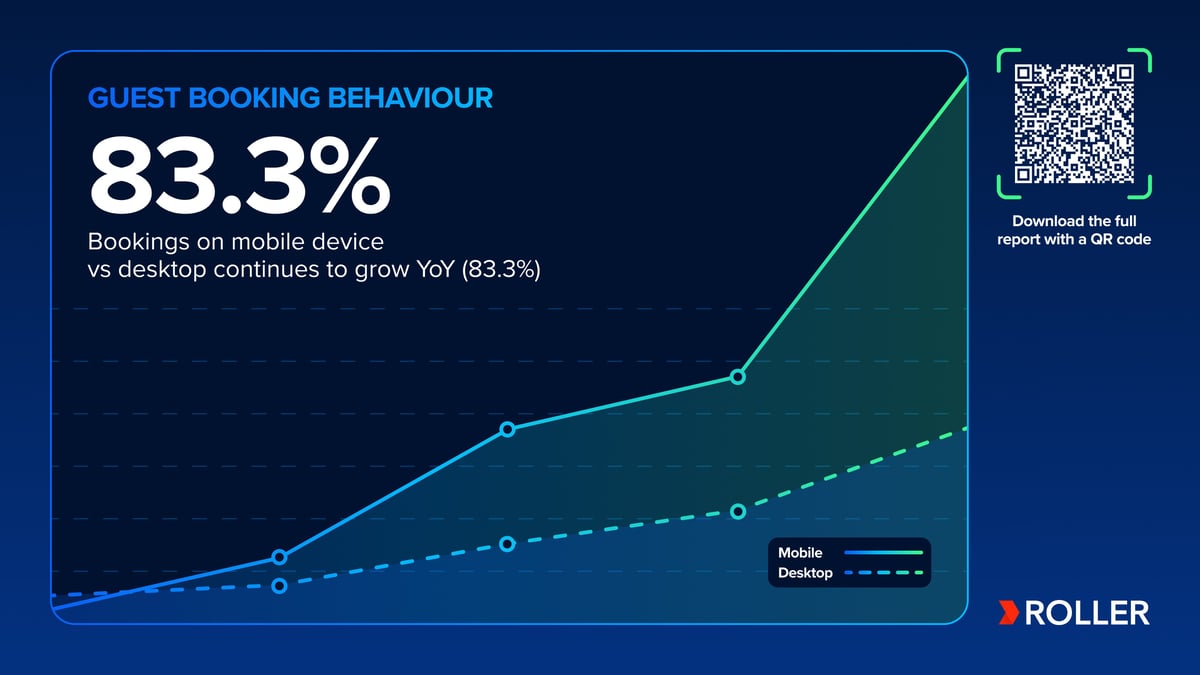
When guests book online for an attraction venue, they are much more likely to be making that booking through a mobile than any other device. In fact, 83.3% of online bookings are made through mobile. But what does this mean for you, the operator? The key insight to uncover here is that having a mobile-optimized online checkout isn’t just a nice to have; it’s essential!
4) Most online bookings are made when a venue is (typically) closed
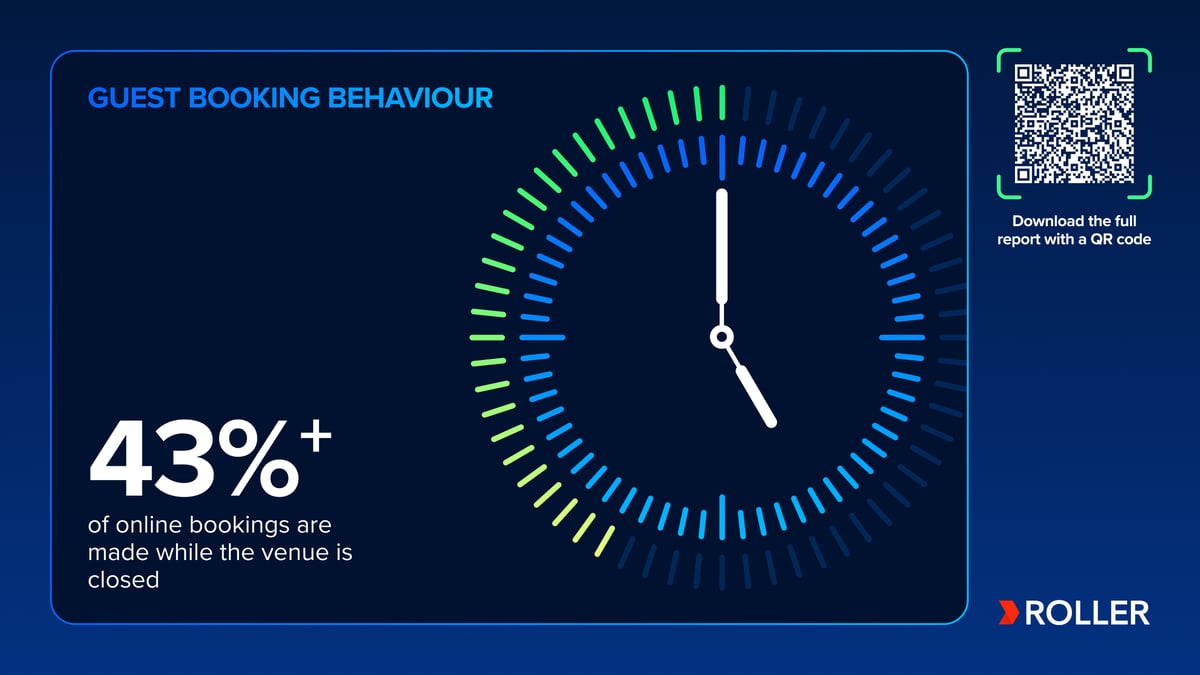
When breaking down popular online booking times, it might surprise you to learn that one of the busiest slots, with 43% of the total bookings, is between 5pm-8am. This is when venues typically start to close (depending on attraction type). The importance of this stat is just how much money you could be leaving on the table if you only take bookings over the phone or in person. A 24/7 online checkout could be a game changer if you don’t already have one.
5) Party bookings are down YoY (but it’s not all bad news)
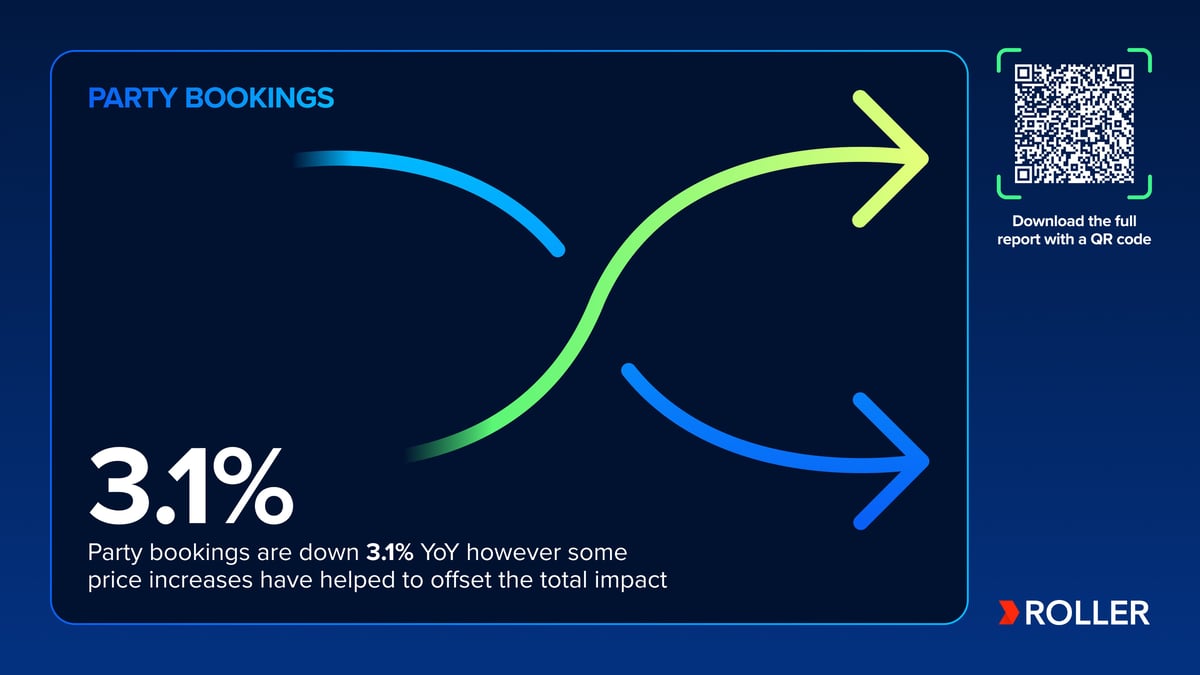
If party bookings at your venue have been slowing down, you’re not alone. Overall, bookings have seen a 3.1% year-over-year dip, largely due to the tighter economic conditions in 2024. However, party revenue has only dipped by 1.1%, suggesting that higher prices and increased spend per guest have helped cushion the blow.
6) Digital wallets are growing and see higher order values
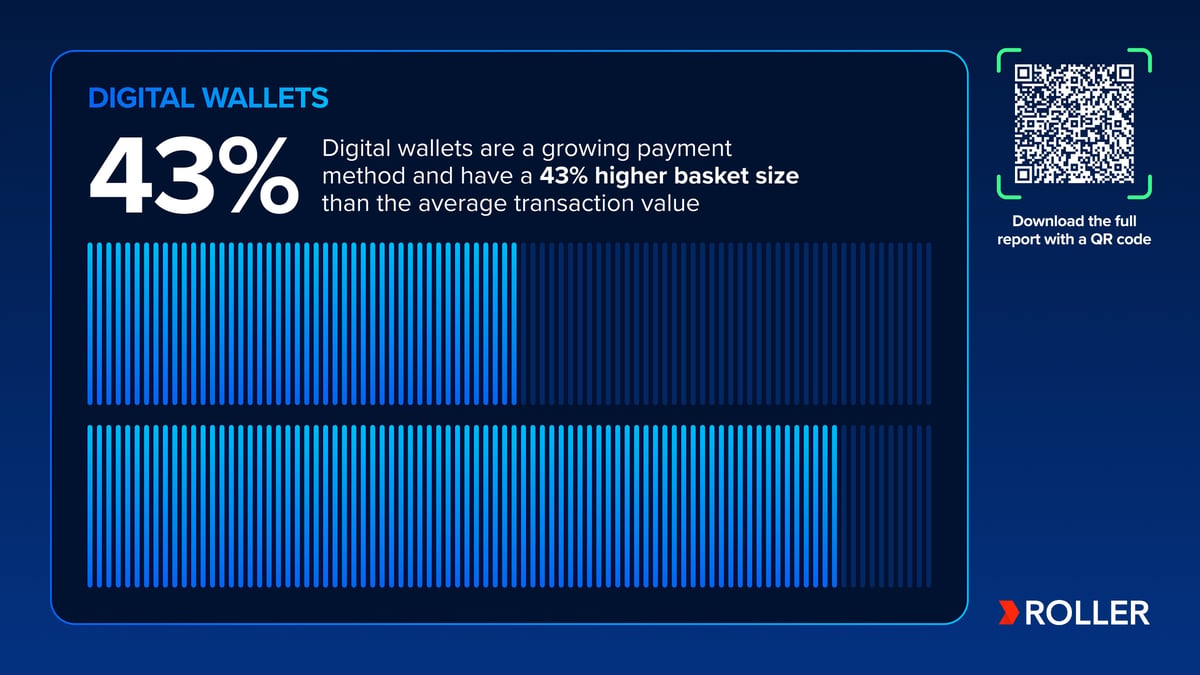
Digital wallets are on the rise, having grown by 5% year-on-year. Plus, the method boasts transaction values a whopping 43.5% higher than the average! By offering flexible payment options like these, venues can not only boost guest spending but also see a noticeable uptick in transaction values.
Ready for the full 2025 Attractions Industry Benchmark Report?
What we’ve shared here is just the tip of the iceberg. The full 2025 Attractions Industry Benchmark Report is packed with even more valuable insights, including region and industry-specific data, expert tips for turning insights into action, and anonymized quotes from industry peers. Don’t miss out—download your copy today and get ready to take your venue to the next level!
Download your copy of the 2025 Attractions Industry Benchmark Report now to discover unmissable insights.
Related articles


6 Unmissable Stats from the 2026 Attractions Industry Benchmark Report

Enhance your guest experience
Get free education, tips and inspiration to help you run a successful venue.
